A Bayesian network (or "Bayes net" for short) is a probabilistic graphical model that describes interdependencies between variables within dataset. In this case the variables are the clinical factors and the dataset is the set of electronic health records (EHRs). Besides visualization, the Bayes nets provide a multimorbidity risk inference engine. Thus one can query a Bayes net for a risk of a particular clinical variable given presence or abscence of other clinical variables in patient's EHR.
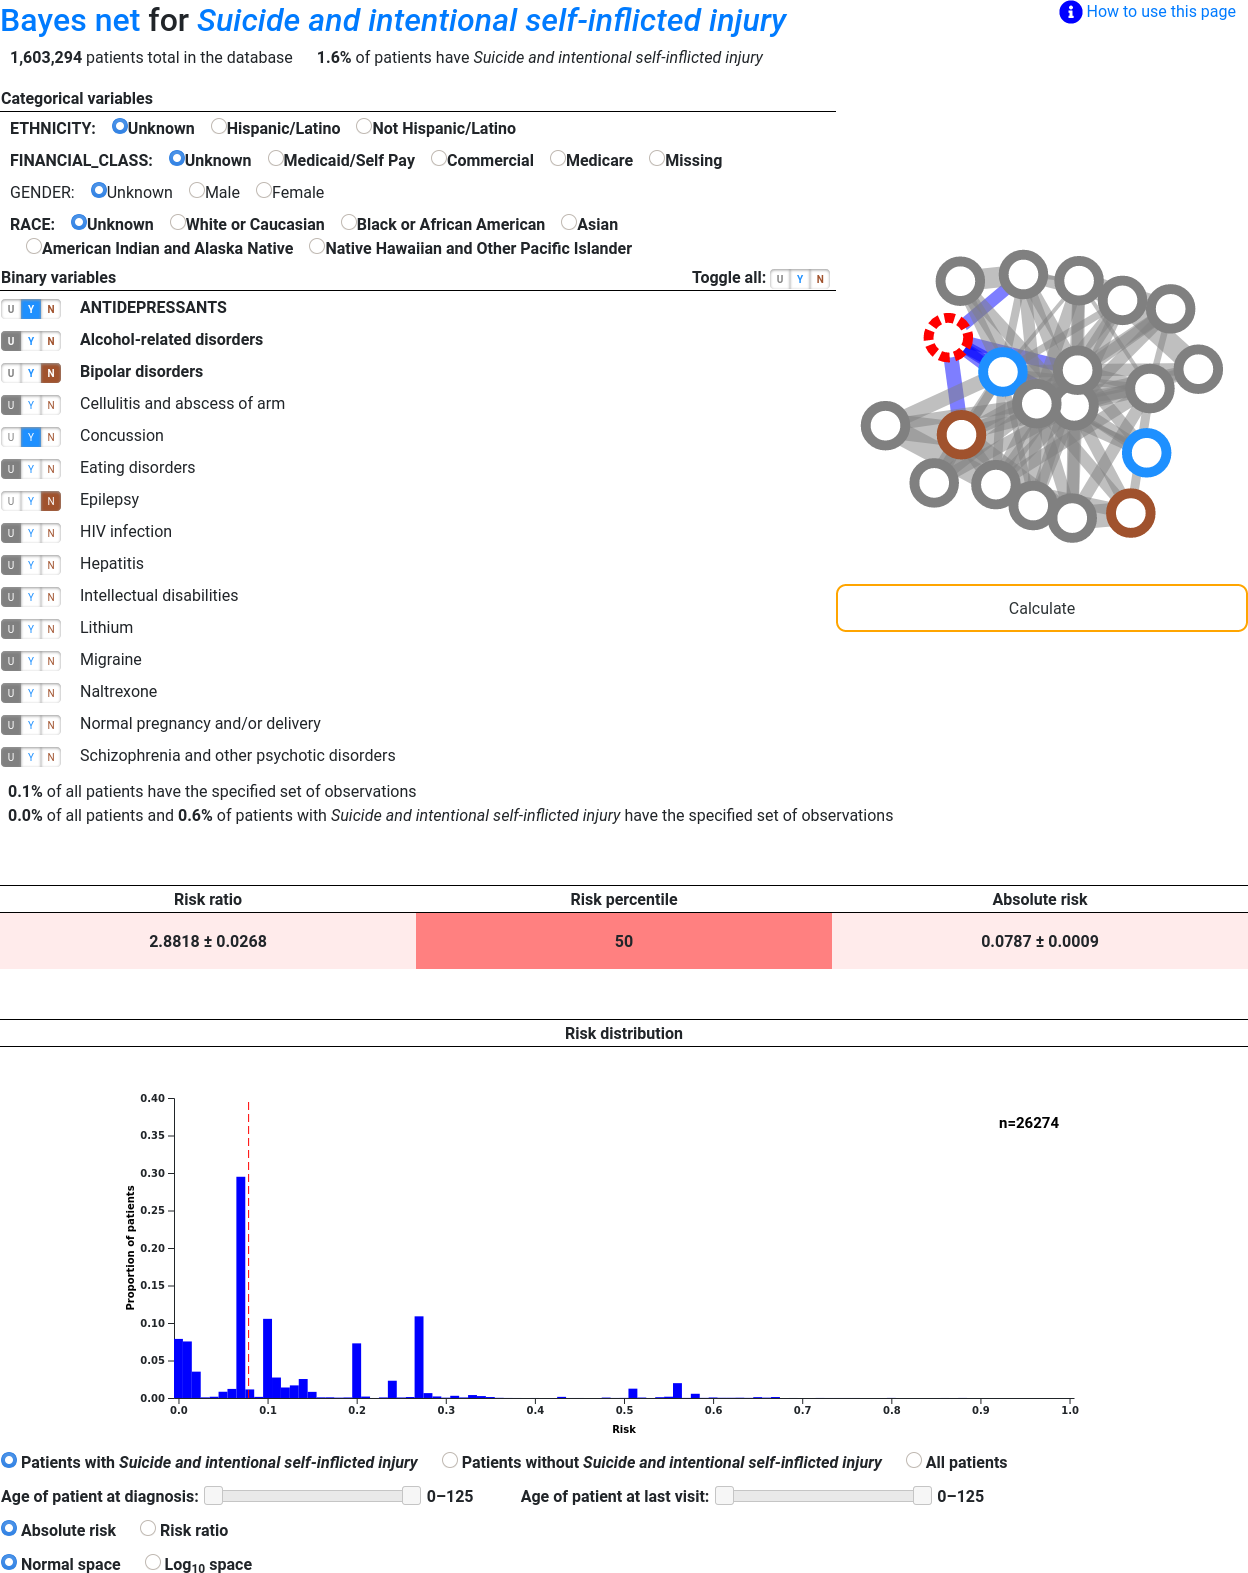
Here is an example Bayes net for predicting whether the term the term "Suicide and intentional self-inflicted injury" appears in a patient's record based on the presence or absence of other terms in their record:
That may seem like an overwhelming amount of information at first, but we will break it down piece by piece.

At the top of the page there is the title of the net, the number of patients that it was based on, and the number of patients with the target term. The title of this net (and its target term) is "Suicide and intentional self-inflicted injury". Clicking on the words "Bayes net" takes you back to the list of available Bayes nets. Clicking on "Suicide and intentional self-inflicted injury" reopens the suicide Bayes net in a new tab so that you can see the effects of different inputs on the prediction without losing the inputs that you previously entered. Hovering over that link will display the name of the specific medical code that the term corresponds to (in this case, ccsdxpb.5.13).

This is a list of categorical variables that are predictive of suicide. The variables in this section generally correspond to demographic information about the patient. Click the terms that best respresent the patient or leave them set to "Unspecified" if information is not available or none of the available options are accurate.
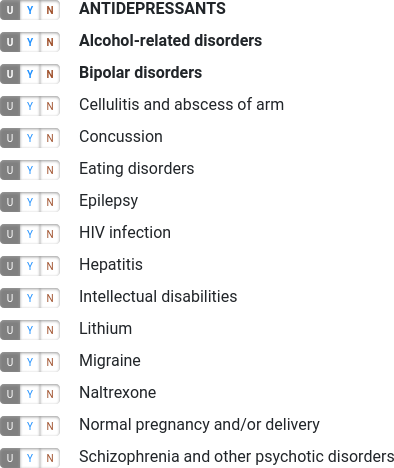
This is a list of binary (yes/no) variables that are predictive of suicide. Click Y if the patient has the term in their medical record, N if not, and U if unspecified. Hovering over any particular term will display its medical code: For example, "ANTIDEPRESSANTS" is cui.927 and "Alcohol-related disorders" is ccsdxpb.5.11.

Variables that are in the Markov blanket are shown in bold. These variables directly influence the target variable rather than influencing the target variable indirectly through mutual association with a third variable. If all variables in the Markov blanket are specified, no other variables need to be specified, and the results will not change if they are.

Some nets do not have a particular target term. If this is the case, a "Set as target" button will be displayed next to each term and clicking it will set the target to that term. The current target is displayed both on the graph and in a textbox at the top of the page labelled "Target expression". Population statistics such as the risk histogram are not available on these nets.

You may have noticed an extra set of Y, N, and U buttons at the top-right of the binary variable list. Use these buttons to set all of the binary variables to Yes, No, or Unspecified at once. Clicking U will also reset the categorical variables to Unspecified.
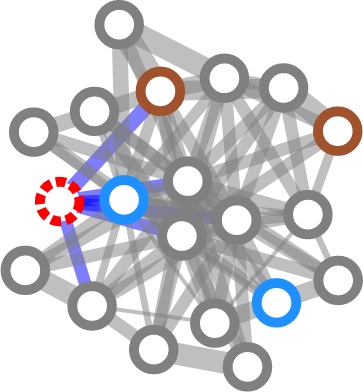
On the right side of the screen is a visual representation of the Bayes net. Each circle in the graph corresponds to a term in the table. Hovering over one of the circles will highlight the corresponding variable on the left, and hovering over one of the variables on the left will highlight the corresponding circle in the graph. The target term (that is, the term to be predicted) is shown in dotted red, terms that are marked Yes are blue, terms that are marked No are brown, and all other circles are colored gray.
Lines that connect circles on the graph represent the influence that one term has on another: The wider the line, the greater the shared information between the two terms. A red line indicates that the two terms are anticorrelated and so having one makes it unlikely that the patient has the other. A blue line indicates that the term has a direct connection with the target term. In other words, blue lines connect terms in the Markov blanket (which are also shown in bold in the table) to the target term.

The most important button on the page, it causes a prediction to be made and the patient's risk ratio, risk percentile, and absolute risk to be displayed. Click this button when you are done selecting inputs.

These are the results of the prediction. On the far right is absolute risk, which is the probability that the patient has the term. On the far left is the risk ratio, which is the patient's absolute risk divided by the average absolute risk over the entire population. The risk percentile in the middle is the number of patients in the population that have an absolute risk less than this patient's. Risk percentiles are not available on Bayes net pages that allow the target variable to be changed.
The standard deviation of the risk ratio and absolute risk is displayed after those values with a plus-or-minus symbol. The standard deviation is calculated by creating multiple Bayes nets via bootstrap resampling from the original population and comparing the predictions from each of the nets. If when the Bayes net was created no resampling was done to create auxiliary nets for comparison, standard deviations cannot be calculated and will not be displayed.
Each cell is colored on a scale from white to red where white represents a low value and red represents a high value. Changing the inputs after a calculation has been made will cause the entire risk table to be grayed out until the Calculate button is clicked again.
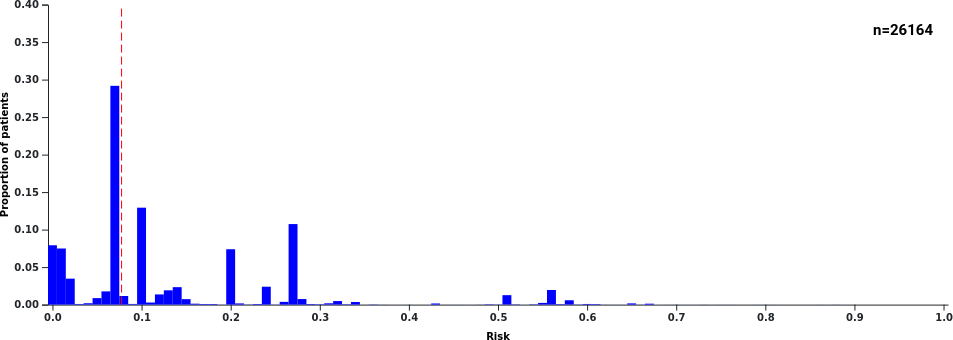
This figure gives you an idea of how the patient's risk compares to other patients in the database. Although the presence or absence of a medical term is known with certainty for each patient in the training set, in order to create the histogram the target term is assumed to be unspecified and recalculated based on the other variables in each medical record. The dashed vertical red line shows where the calculated risk of the described patient falls compared to other patients.
The number of patients included in the histogram is shown in its upper-right corner. It may be manipulated by changing the histogram options (which are just below the histogram itself). The histogram will update automatically when its options are changed but will be grayed out while it is being redrawn.
Histograms are not available on Bayes net pages that allow the target term to be changed.